
dSysMap is a resource that maps mutations related to human diseases on the structure of proteins and interactions in the human interactome. Human disease-related mutations are obtained from Uniprot and are mapped on the structures of single proteins and protein-protein interactions obtained from Interactome3D.
By mapping mutations on the human structural interactome we can classify them based on the position they have inside the structures as buried, surface or interface mutations. Furthermore, we can locate their position inside the interactome and determine if they affect the nodes in the network (buried or surface mutations) or the edges (interface mutations) and we can also relate mutations for one disease to the ones for other diseases that affect the same protein or proteins in the interaction neighborhood. This allows to put disease-related mutations in a systemic context and helps in rationalizing the mechanism of action of those mutations and unveil previously unkown relationships between diseases.
dSysMap is pronounced dee-sees-map similarly to Disease map.
You can query dSysMap in three different ways:
- By selecting a disease from the list of diseases.
Diseases are classified into categories (obtained from the Comparative Toxicogenomics Database). You can either browse the hierarchy with your mouse or you can type the name of a disease in the search box. The hierarchy will scroll to the first disease whose name match your input. - By searching for a list of proteins of your
interest.
You can enter a list of proteins and visualize their interaction neighborhood together with the mutations that affect those proteins. - By introducing your own list of mutations.
See below for a description of how this works.
By querying dSysMap in one of these way you will be directed to a page representing the resulting network of proteins together with the disease mutations that affect them. See the following section for a description of this page.
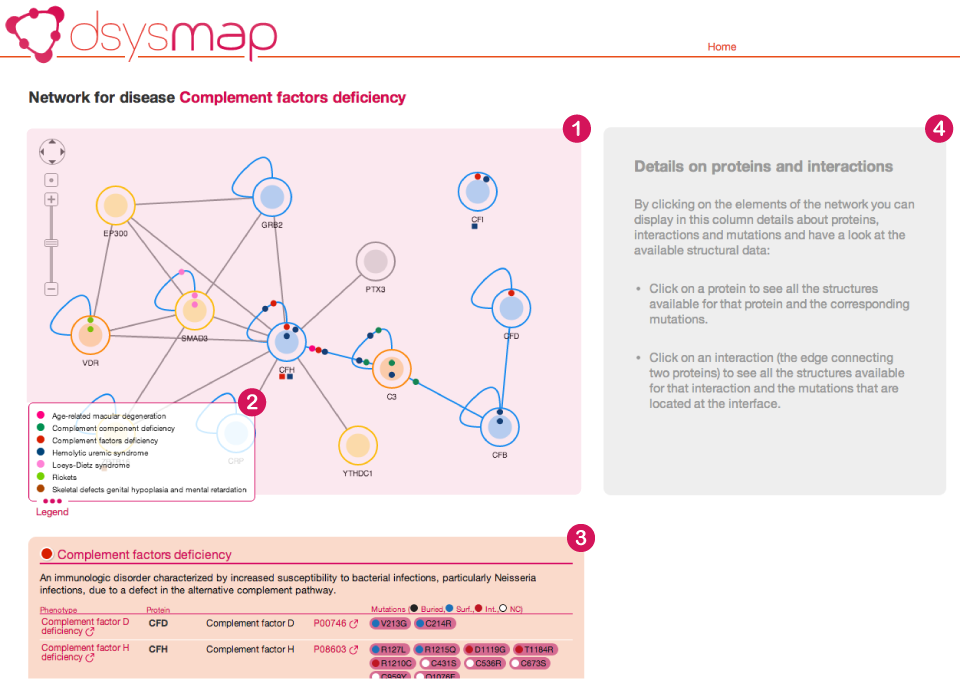
The page showing the results of a query to dSysMap is similar to what is shown in the following image.
![]()
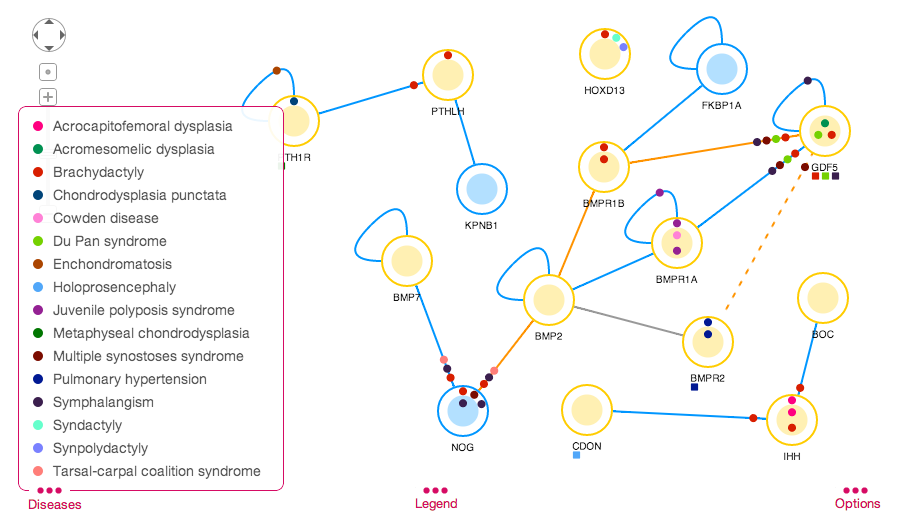
At the top of the page you can find an interactive representation of the network of proteins resulting from your query (1). Nodes in this network represent proteins while edges represent protein-protein interactions (PPIs), as collected from public PPI databases.
Nodes are colored based on the availability of structural information about the corrsponding protein:
| Protein with complete structure | Protein with complete model | ||
| Protein with partial structs/models | Protein without structural data |
The edges are colored based on the availability of structural information about the corresponding interaction:
| Interaction with experimental structure | Interaction with model (from global template) | ||
| Interaction with model (from domain-domain template) | Interaction without structural data |
Small colored circles indicate the presence of mutations related to a certain disease either on the protein or at the interface between two proteins. Every disease has a different color and you can find a legend for the colors at the bottom left of the Network view (2). We call these circles mutation discs. Every node contains two parts:
- A shaded circle in the center (which represents the core of the protein): mutation discs in this part correspond to buried mutations for a particular disease;
- A white band along the border of the node (which represents the surface of the protein): mutation discs in this part correspond to surface mutations for a particular disease that cannot be mapped to any interaction;
| Protein with buried mutations | Protein with surface mutations (that cannot be mapped to an interface) |
Mutation discs on an edge represent disease mutations that can be mapped to the interface between two proteins and might therefore affect the interaction between the two proteins. Discs on an edge are closer to the node on which the corresponding mutations are found. In the following image, for example, mutations represented by the disc "a" are found on protein 1 while mutations represented by the disc "b" are found on protein 2.
| Interface mutations. Mutations (a) are on protein (1), mutations (b) are on protein (2) | ||
It is IMPORTANT to note that one mutation disc represents all the mutations for a specific disease in one of the structural categories (buried, surface or interface). Therefore, one mutation disc might correspond to multiple mutations.
If one mutation disc is surrounded by a circle of the same color this means that there is at least one phenotype belonging to the corresponding disease for which the interaction interface is enriched by mutations of that phenotype. Enrichments are calculated for every phenotype by using the following formula
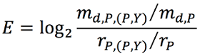
where md,P,(P,Y) is the number of mutations for the phenotype d that can be mapped to the interface of protein P in the interaction (P,Y), md,P is the number of mutations for the phenotype d that can be structurally mapped on protein P, rP,(P,Y) is the number of residues that belong to the interface of protein P in the interaction (P,Y) and rP is the number of structurally mapped residues for P. We assessed the significance of the enrichments through the p-value of a binomial distribution of parameter p=rP,(P,Y)/rP. Whenever the mutations were present on both sides of the interface, we calculated the enrichments on the sum of the residues of the two proteins. P-values were corrected for multiple testing on the number of interactions for each disease phenotype, using a Benjamini–Hochberg procedure.
| Interactions enriched for mutations of a disease. Mutations for disease (a) are enriched on the interface of the interaction between the two proteins. This is indicated by a circle around the mutation disc. | ||
Self-loops represent homomeric interactions. Below the network we can find a list of diseases that affect the proteins in the network.

![]()
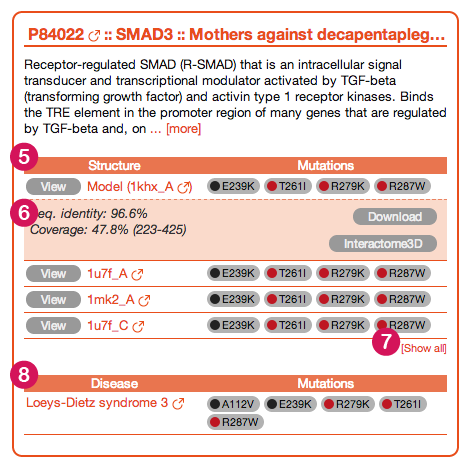
The first disease (in a light pink colored box, (3) and (5)) is the main disease, i.e. the one with which we initially queried dSysMap. Inside the box we can find a short description of the main disease phenotype (obtained from the humdisease.txt file from Uniprot ) and a table which reports all the different phenotypes associated to this particular disease (6) and the proteins having mutations of the respective phenotype. For every protein the table reports the corresponding list of mutations (7) marked with a colored spot that identifies the structural classification of the affected residue (buried, surface, interface or Not available, in case there is no structure containing that particular residue). By hovering over a mutation you will be presented with a pop-up windows containing several details about the mutation, including a link to the corresponding Swiss-var page and the list of interactions whose interfaces contain the mutation

![]()
The remaining boxes in gray (8) correspond to other diseases that have mutations on any of the proteins in the neighborhood of the main disease. By showing also these diseases, dSysMap helps in establishing relationship between them and possible common mechanism of actions.
The Network view is interactive. This means that you can move the nodes around, and you can select proteins (by clicking on the nodes) or interactions (by clicking on the edges). When you select a protein or an interaction dSysMap shows their corresponding details (including their structures and the mutations that can be mapped on them) in the right panel (4).
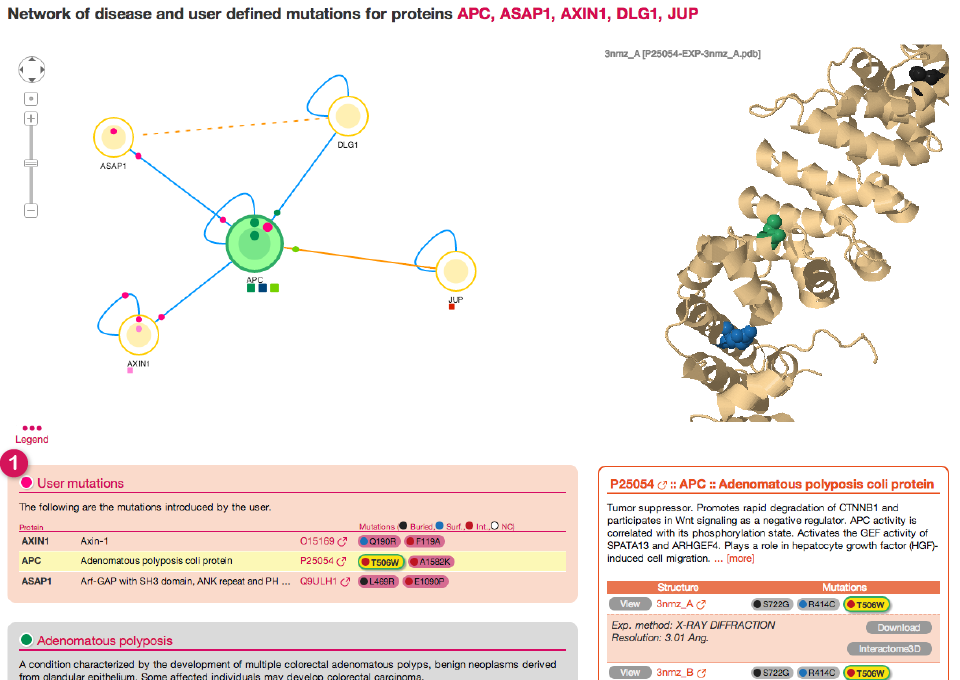
When you click on a node in the network, dSysMap will show information about the corresponding protein in the right panel. At the same time the protein is highlighted in green in the Network view (1) and with a yellow line in the list of diseases beneath (4).

![]()
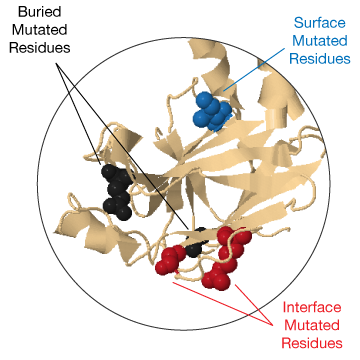
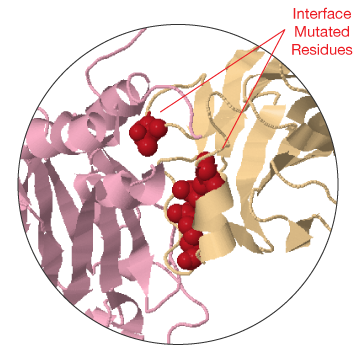
In case there are structures or models available for the selected protein they are shown on the top part of the right panel (2) in a JSmol view. The view is interactive: you can move and zoom the structure using the mouse. Mutated residues are highlighted with a sphere representation and are colored based on their position in the structure (black for buried residues, blue for surface residues and red for interface residues).
The lower part of the right panel (3) shows information about the protein.
![]()
After a short description of the protein function (obtained from Uniprot ) you can find a list of all the structures and models available for the protein (5). By clicking on the view button you will be able to see the corresponding structure in the JSmol view above. For every structure the mutations that can be mapped on it are listed. Furthermore, you can see details for the structure (6) currently shown, together with a button for downloading the corresponding PDB file and a link to the corresponding entry in Interactome3D. Be aware that, by default, only the first 4 structures are shown. If you want to show all the structures you can click on the link at the bottom of the table (7).
Finally, a table shows all the prenotypes having mutations that can be mapped on any structure of the selected protein (8).
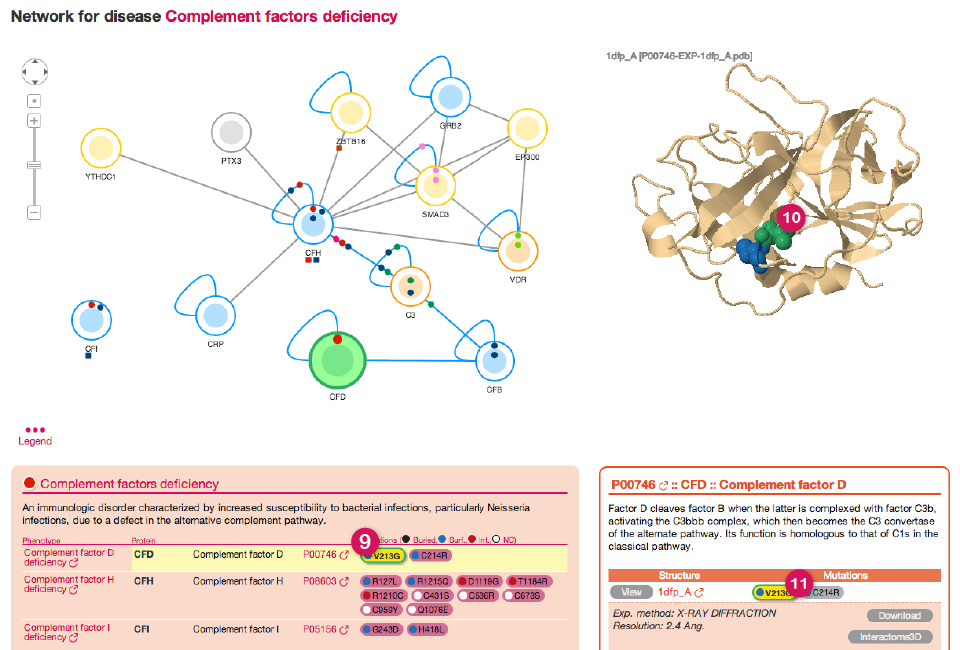
The different views in dSysMap are linked together. If you click on any mutation (9) (see next image) that has a structural classification dSysMap will highlight in green the mutated residue in the first available structure for the protein (10) and throughout all the page (9) and (11). The same happens if you click on one of the mutated residues in the JSmol view.
![]()
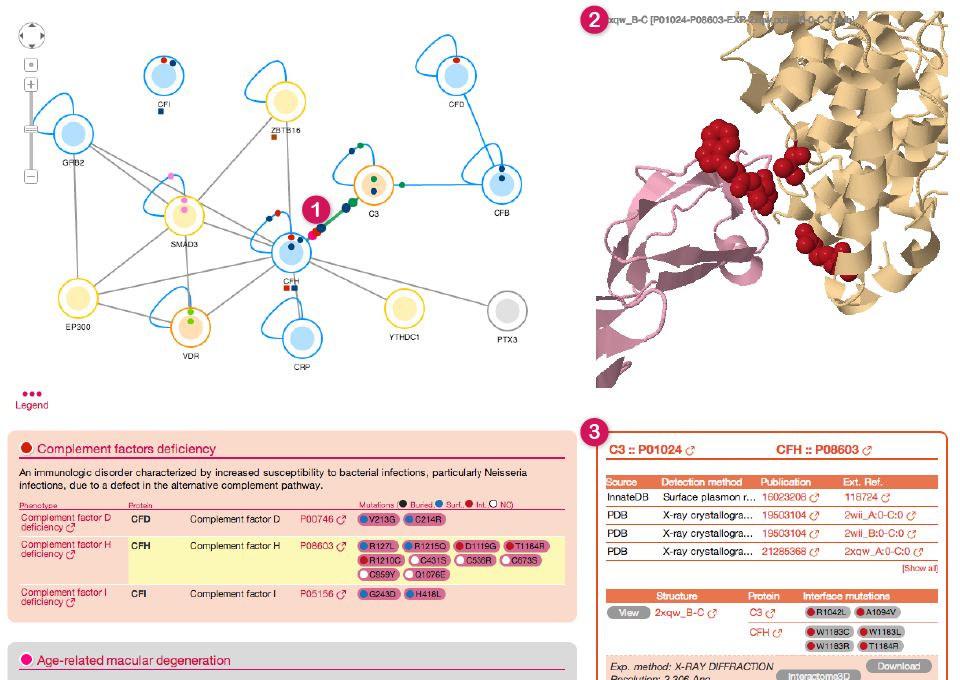
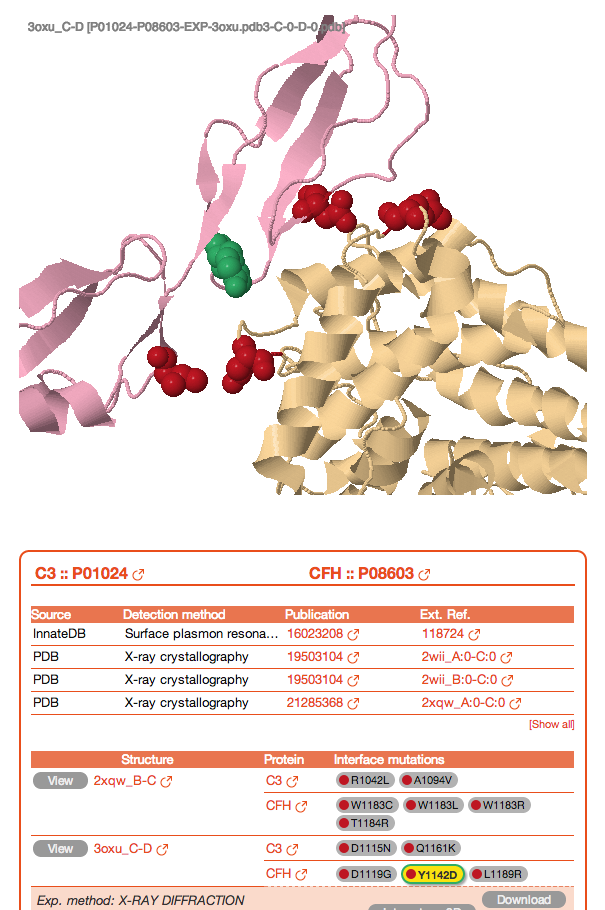
By clicking on any edge in the Network view you can visualize information about the corresponding protein-protein interaction.
![]()
The corresponding interaction gets highlighted in the network (1), available structures are shown in the top part of the right panel (2) together with information on the PPI below (3).

![]()
On the top, you can find a list of all experimental evidence for the interaction (4) with links to the original protein-protein interaction databases. Below (5) a table lists all the structures and models together with the interface mutations that can be mapped on them. Please, be aware that on this particular view *ONLY* mutations at the interface between the two proteins are shown. The rest of the mutations affecting the two proteins can be shown by clicking on the two nodes individually.
The table also reports details about the structure shown in the JSmol view and links to download the corresponding PDB file and view the corresponding entry in Interactome3D (7). Finally, at the bottom, a table shows all the phenotypes related to mutations that can be found on any interface for the selected interaction. By clicking on any of the mutations in the right column you can highlight it in green in the JSmol view above.
![]()
dSysMap gives you the opportunity to display your own list of mutations on the corresponding network together with all the other disease mutations contained in the database. In order to do that you have to enter your list of mutations in the input box on the right bottom corner of the home page.

![]()
Mutations must be specified in the following simple format:
- Every protein goes on a separate line
- The line starts with the protein name (either the gene name or the Uniprot AC) followed by a column, followed by a comma separated list of mutations
- Each mutation can be specified as p.<original_residue><residue_number>[mutated_residue] (ex. the mutation of Arginine 254 to a Lysine should be specified as p.Arg254Lys). You can also use the simplified notation <one_letter_original_residue><residue_number>[one_letter_mutated_residue] (for ex. R254K). The mutated residue is optional, i.e. you can specify a mutation at a certain residue without having to specify the amino acid it is mutated to (for ex. R254).
- You can specify proteins that you want to be included in the visualization of the results even if they do not carry any mutation. Simply add their gene name or Uniprot AC in a separate line (without the following column character)
Once you click on Submit you will get to the Network view and your list of mutation will be listed together with the other diseases in a separate box with the title User mutations (1).
![]()
The Download page allows you to download the data contained in dSysMap in different ways.

![]()
- You can enter a list of proteins of your interest and download all the disease mutations annotated for those proteins and the protein interactions involving them (1)
- You can select one disease and download the corresponding mutations (2)
- You can download all the mutations contained in dSysMap (3)
Once you select one option the files to download will appear on the right (4). These are 5 different files:
- <dataset>_mutations.dat Lists all the mutations in the dataset. It contains the following columns:
| # | Name | Description |
|---|---|---|
| 1 | DISEASE | Name of the disease (group of phenotypes) |
| 2 | PHENOTYPE | Name of the specific phenotype. dSysMap groups different phenotypes belonging to the same disease. |
| 3 | MIM | MIM for the entry in OMIM corresponding to the phenotype |
| 4 | GENE_NAME | Name of the Gene |
| 5 | UNIPROT_AC | Uniprot Accession code |
| 6 | RES_NUM | Mutated residue number in the Uniprot canonical sequence |
| 7 | RES_ORIG | Original residue in the Uniprot sequence |
| 8 | RES_MUT | Mutated residue |
| 9 | SWISSVAR_ID | Identifier of the mutation in SwissVar |
| 10 | STRUCT_CLASS | Structural classification of the mutation (BURIED or SURFACE), if available (NA=Not available) |
| 11 | INTERFACE | YES in case the residue is found on any interface, NO otherwise |
- <dataset>_mutations_prot_structs.dat Lists all the structures available for a certain protein and the mutated residues that can be mapped on those structures. It contains the following columns:
| # | Name | Description |
|---|---|---|
| 5 | UNIPROT_AC | Uniprot Accession code |
| 6 | RES_NUM | Mutated residue number in the Uniprot canonical sequence |
| 7 | RES_ORIG | Original residue in the Uniprot sequence |
| 1 | STRUCT_TYPE | Type of structure; can be one of: Structure (for experimental structures), Model (for homology models) |
| 2 | PDB_FILENAME | Name of the PDB file; all the PDB files are contained in a tarball that can be downloaded (see below) |
| 3 | CHAIN | Chain inside the downloaded PDB file |
| 4 | STRUCT_RES_NUM | Number of residue in the structure chain (including insertion code, if any) |
| 8 | STRUCT_RES_NAME | Name of the residue in the structure (might not correspond to the Uniprot sequence, in case of structures carrying mutations) |
| 9 | CLASSIFICATION | Structural classification of the residue (BURIED or SURFACE) |
- <dataset>_mutations_interf_res.dat Lists all the structures available for the protein-protein interactions in the network of the dataset and the corresponding interface residues. It contains the following columns:
| # | Name | Description |
|---|---|---|
| 5 | UNIPROT_AC | Uniprot Accession code |
| 6 | RES_NUM | Mutated residue number in the Uniprot canonical sequence |
| 7 | RES_ORIG | Original residue in the Uniprot sequence |
| 1 | STRUCT_TYPE | Type of structure; can be one of: Structure (for experimental structures), Model (for homology models from global templates), Dom_dom_model (for homology model from domain-domain structural templates). See the Interactome3D help for a description of the different types of interaction structures and models. |
| 2 | PDB_FILENAME | Name of the PDB file; all the PDB files are contained in a tarball that can be downloaded (see below) |
| 3 | CHAIN | Chain inside the downloaded PDB file |
| 4 | STRUCT_RES_NUM | Number of residue in the structure chain (including insertion code, if any) |
| 8 | STRUCT_RES_NAME | Name of the residue in the structure (might not correspond to the Uniprot sequence, in case of structures carrying mutations) |
| 9 | PARTNER | Interacting partner on the other side of the interface |
| 9 | PARTNER_CHAIN | Chain corresponding to the interacting partner in the PDB file |
- <dataset>_prot_structs.tgz Tarball of all the PDB files listed in the <dataset>_mutations_prot_structs.dat file
- <dataset>_int_structs.tgz Tarball of all the PDB files listed in the <dataset>_mutations_interf_res.dat file
The data contained in dSysMap can be accessed programmatically through a RESTful interface. The interface is available through the 'api' subfolder and the URL of the request is encoded as in the following examples:
http://dsysmap.irbbarcelona.org/api/getMutationsForProteins?protein_ids=C3,CFB,CFH http://dsysmap.irbbarcelona.org/api/getMutationsForDisease?disease=Alzheimer%20disease
The following functions are available:
- getMutationsForProteins It returns all the
mutations mapped by dSysMap on a group
of proteins. It takes one parameter protein_ids
encoded as a comma separated list of protein IDs (no spaces
allowed). The protein IDs can be either Uniprot Accession
Codes or gene names (valid in the version of Uniprot used by
dSysMap, see the statistics). A maximum of 10
protein IDs can be passed to the function.
The function returns an XML encoded string which contains a main element named results. This elements contains up to three children:- mutations Contains a set of mutation records whose fields are the same as the ones in the file <dataset>_mutations.dat that was previously described, encoded in XML.
- structured_residues Contains a set of structured_residue records whose fields are the same as the ones in the file <dataset>_mutations_prot_structs.dat that was previously described, encoded in XML.
- interface_residues Contains a set of interface_residue records whose fields are the same as the ones in the file <dataset>_mutations_interf_res.dat that was previously described, encoded in XML.
- getMutationsForDisease It returns all the mutations
mapped by dSysMap for the disease passed
to the function. It takes one of the following parameters:
- disease The name of a disease (group of phenotypes)
- phenotype The name of a disease phenotype
- mim The MIM of the disease phenotype
- mapMutations It allows users to submit their own
sets of mutations to have them mapped on the human
structural interactome. It takes two arguments:
- mutations the
specification of the mutations is the same as for the
"Submit your mutations" section in the main page (see here for
a description of the format). In this case, no spaces
are allowed in the specification and instead of
introducing different proteins in different lines you
need to separate their specifications with the vertical
bar "|". For example:
http://dsysmap.irbbarcelona.org/api/mapMutations?mutations=APC:p.Ala1582Lys,p.Thr506Trp|AXIN1:p.Phe119Ala,p.Gln190Arg
You can specify up to 10 mutations in total. - extend By
default dSysMap will return only the mutations submitted by the
user. It is possible to also get, together with the user
mutations, all the disease mutations in the database for the
same set of proteins by setting the
extendparameter to 1
User mutations - mutations the
specification of the mutations is the same as for the
"Submit your mutations" section in the main page (see here for
a description of the format). In this case, no spaces
are allowed in the specification and instead of
introducing different proteins in different lines you
need to separate their specifications with the vertical
bar "|". For example:
- getPdbFile It can be used to retrieve the PDB files
contained in dSysMap (either
experimental structures or models used for the structural
mapping of mutations). It takes one parameter filenames encoded as a comma
separated list of filenames (no spaces allowed). The
filenames must correspond to the ones contained in the pdb_filename field of the results
returned by either one of the other functions (or in the
files downloaded from dSysMap). A
maximum of 10 filenames can be passed to the function.
The function returns an XML file which contains a main element named results. This element contains as many pdb_file children as the files that were requested, each containing the contents of the corresponding PDB file.